Keeping your finger
on the pulse
In most cement production cases, pulse jet cleaned filter systems with textile filter elements serve to dedust product and exhaust gas flows. In recent years, these filter systems have largely displaced less effective processes, such as cyclones or electrostatic precipitators, and now dominate the market. Equipped with filter bags made of high-quality polymer or glass fibres, pulse jet cleaned filter systems master a number of challenges when it comes to the effective dedusting of exhaust gas flows.

Effective dedusting of exhaust gas flows
This article deals with the possibility of analysing and increasing the performance of these filter systems. For this purpose, a suitable measuring method is presented, possible measuring tasks are defined, and potential solutions are considered for an operating filter bag system.
The variety of bag filter systems operating in the market is enormous, but their tasks can be summarised with a few recurring parameters:
- Compliance with current legislation regarding gaseous and dust emissions that may be released into the environment is imperative.
- Business management aspects and current climate policy require the lowest possible use of energy.
- In-house operational limits, such as fan power, only allow one mode of operation within those.
- A long service life of the filter bags and a low maintenance effort are also desirable for reducing maintenance costs.
These parameters are related and interact with each other. If, for example, the filter elements are frequently cleaned, the differential pressure and the energy costs decrease directly, but at the same time, the emission of dust-like particles increases, and the service life of the filter bags decrease.
In order to find the optimal operating point of an existing filter system, numerous time-consuming test series are common, which can also disrupt the regular production process. The goal is an independent measurement method, which does not interfere with the control system, but nevertheless illustrates and documents changes in the behaviour of the filter system quantitatively and in real time.
For this purpose, BWF Envirotec developed measuring probes based on the principle of the Prandtl tube. The measuring probe is positioned at any height in the filter bag to be analysed. When the fan is in operation, the exhaust gas flows through the filter bag from the outside in and rises upwards towards the clean gas chamber. The gas flows around the probe, which is located in the centre of the bag. The probe tip has a hole that receives the so-called ‘stagnation pressure’. The exhaust gas flows past further lateral bores without stagnation. Therefore, there is only static pressure here.
The Bernoulli equation defines the relationship between the two measured pressures:
p (stagnation) = p (static) + p (dynamic)
If the exhaust gas density is known, the flow velocity v in the filter bag can be calculated directly from the dynamic pressure:
p (dynamic) = ½ * ϱ * v2 and v = √(2*p(dynamic)/ϱ)
Static and dynamic pressure and the flow velocity calculated from this serve as a guide for possible optimisation tasks.
The measuring process works independently. All that is required is a 230 V connection and a cable passage from the clean gas chamber to the environment. The measuring probes are heat-resistant and can therefore be used in temperatures up to 220˚C.
For the measurement, the corresponding chambers must be opened, the blow tubes temporarily removed, and the probes positioned in the filter bags at the desired height. The blow tubes are then reassembled, and the chambers closed. The measurement is now ready. Simultaneous measurements with four probes within one chamber are possible. Depending on the scope of measurement, 2 – 3 days (plus arrival) are required.
With the measurement method just described, the following parameters that are relevant for optimisation can be determined quickly and without great effort:
- The pressure surge in the filter bags reached during cleaning, depending on the position along the blow tube
- Distribution of the maximum pressure surge over the height of a filter bag
- The amount of pressure surge in the filter bag depending on the tank pressure
- Influence of the valve opening time on the maximum pressure surge
- Influence of the cycle duration on the differential pressure
- Influence of the cleaning sequence on the differential pressure
- Influence of the blow hole on the pressure build-up in the filter bag
- Effect of blow tube nozzles and Venturi on the pressure build-up
- Influence of different filter media on the differential pressure
Only some of the many measurement tasks listed above can be discussed.
The operator of a cement plant complained of a high differential pressure or insufficient gas flow through the filter system because the fan power limit was reached. Both parties agreed on a measurement campaign to investigate the causes of this.
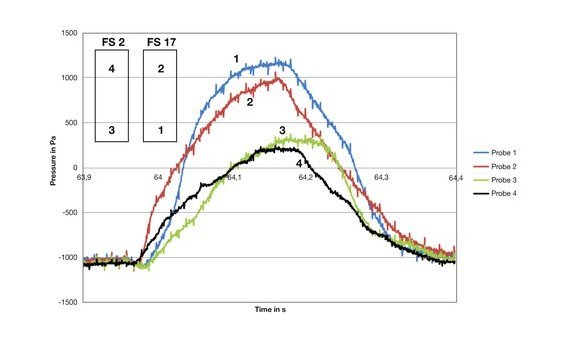
BWF Envirotec installed four measuring probes on a blow tube that was initially selected as desired. Probes 1 and 2 were installed at different heights in the filter bag (FS17) at the end of the blow tube. Probes 3 and 4 were installed in the second filter bag as seen from the pressure tank.
Figure 1 shows the measured pressure build-up during pulse jet cleaning as a function of the measurement duration. Since the measurement is carried out during operation, a negative pressure of -1000 Pa is applied to both filter bags 2 and 17 on the clean gas side compared to the raw gas side. As soon as the valve of the pressure tank opens, compressed air flows through the blow pipe into the filter bags underneath. This fills the filter bag, compensates for the negative pressure, and builds up positive pressure inside the filter bag. Only then will the filter bag inflate and throw off the dust cake that has been filtered on. If the pressure build-up is insufficient, the filter cake is not cleaned off and the filter bag offers the same resistance to the gas stream flowing through as before the cleaning.

Figure 1. Pressure build-up during cleaning of filter bags 2 and 17
As can be clearly seen, the pressure build-up within a filter bag hardly differs. The probe at the top indicates the start of pressure build-up earlier than the bottom one, as the cleaning air takes a few milliseconds to flow down. At the maximum pressure level, probes 1 and 2 (or 3 and 4) differ only slightly. This means that the pressure build-up takes place relatively evenly along the height within a filter bag.
However, there are clear differences in the position of the filter bag in relation to the blow tube. Filter bag 17 installed at the end of the blow tube reaches a maximum overpressure of 1000 Pa compared to the raw gas side. Experience has shown that this is usually sufficient for an effective cleaning of the filtered filter cake. This does not seem to be the case with filter bag 2. The zero line is just crossed, so insufficient cleaning can be assumed. Examination of further blow tubes and filter bag positions proved that all filter bags in the front positions suffered from the same symptom.
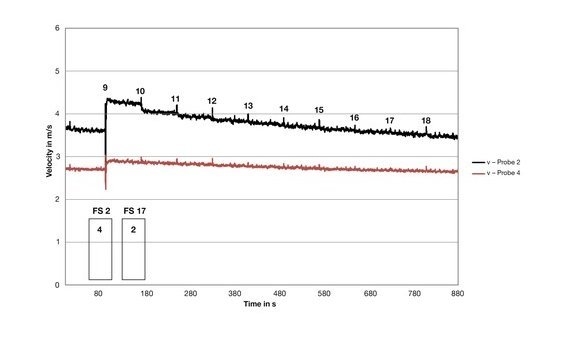
Figure 2. Flow velocity in filter bags 2 and 17 during two cleaning pulses
Figure 2 illustrates the possible effects of pulse jet cleaning. After filter bag 17 (black line) has been cleaned, the resistance to the gas flowing through decreases because the dust cake has been removed. This is expressed by a spontaneous increase in the flow velocity in the filter bag from approximately 3.6 m/sec. to approximately 4.3 m/sec. in the direction of the clean gas chamber. This confirms the effective cleaning of filter bag 17, which is already assumed due to the high-pressure build-up described before. Filter bag 2 (red line) shows only a slight increase in flow velocity, which confirms the suspicion that the filter bag is not cleaned properly. The overall significantly lower flow velocity indicates that the filter bags positioned at the front contribute to the filtration process to a far lesser extent.
Further detailed analysis of the flow velocity in filter bag 17 (black line) shows a further abnormality. As already mentioned, immediately after cleaning (with a time axis of 80 sec.) the flow velocity suddenly increased to approximately 4.3 m/sec., followed by a continuous decrease (caused by the increase in filter cake) until time axis 180 sec. an unexpected abrupt decrease of approximately 0.2 m/sec. occurs. This takes place at the same time as the cleaning of the adjacent blow tube 10, so that it can be assumed that cleaned-off dust is re-entrained to the previously pulsed bag row 9. Experience shows that the finer and more free-flowing the filter dust, the more this occurs.
When cleaning more distant blow tubes, the effect of the re-entrainment subsides and is no longer noticeable four rows further (time axis approximately 400 sec.). Without re-entrainment effects, the flow rate in filter bag 17 would decrease significantly more slowly. This would keep the higher gas throughput much longer and would lead to a slower dp increase. This can be achieved by changing the cleaning sequence from successive (row by row) to staggered (skipping 3 rows).
Minor design changes to the blowpipe and an adapted cleaning sequence could reduce the differential pressure or increase the gas throughput through this filter system. The final example is the optimisation of the total costs of a filter system based on the cleaning cycle time. BWF Envirotec defines cleaning cycle time as the time until one and the same bag row is cleaned again.


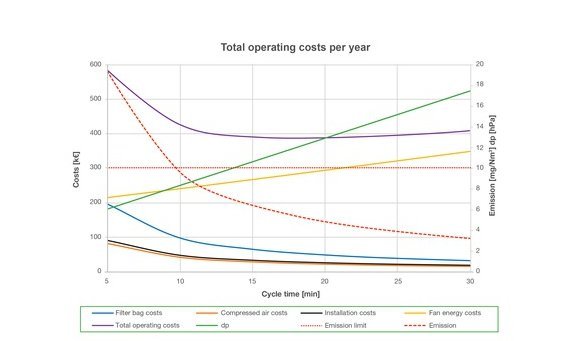
Figure 3. Total operating costs per year
Figure 3 displays the individual and total costs depending on the selected cycle duration on the left axis. The right axis shows emission and differential pressure, which could possibly have a limiting influence on the choice of the optimal cycle duration. A shortening of the cycle duration, i.e. frequent cleaning of a filter bag, affects the differential pressure in a positive way, this and with it the energy costs of the fan decrease accordingly. A drastic increase in dust emissions caused by the numerous emission peaks that occur with every pulse jet cleaning speaks against this mode of operation. In this example, the statutory regulation of 10 mg/Nm3 of dust emissions is exceeded for a cycle duration of less than 10 minutes, so that an operational limit is reached here.
An increase in the cycle duration, on the other hand, has a positive effect due to a sharp decrease in dust emissions, which is preferable for reasons of environmental protection. At the same time, the cost of compressed air is reduced because cleaning is less frequent. Filter bag procurement and assembly costs are also lowered with a longer cycle time, since fewer pulses cause less mechanical wear and ageing on the installed filter bags and these have a longer service life.
This contrasts with the increasing energy costs for the fan and reaching the performance limit. In the example shown, the lowest total costs would occur with a cycle time of approximately 20 minutes, a differential pressure of 1300 – 1400 Pa and dust emissions of approximately 5 mg/Nm3. If, on the other hand, the fan’s performance limit had been reached at 1200 Pa, the cycle time would have to be set to 15 minutes instead. In this or a similar way, BWF Envirotec can individually optimise an existing filter system to maximise its operational and economic efficiency.
Summary
Existing filter systems often do not work at their energetic optimum. This increases the overall costs and harms the environment. The BWF Envirotec service team offers a solution in the form of filter system optimisation with specially developed measuring probes. These can be used in practically every pulse jet cleaned filter system with vertically installed filter bags. The measurement does not interfere with the control of the filter system, but does provide meaningful data in real time. The optimal operating point and the lowest total costs can be determined immediately from the received data. With large filter systems, such as a cement kiln filter, the costs of the measurement campaign are amortised within a few weeks. A measurement campaign can ideally be carried out as part of other services provided by the BWF Envirotec service team, such as filter bag assembly, filter house maintenance and leakage tests.
About the author
Ernst Rohner is Director Global Process & Application Technology of BWF Envirotec. BWF Envirotec is the global solution provider for industrial dedusting offering filter bags, services and application-oriented consultation for bag houses.